Avoiding false spikes in time series graphs when using Graphite's perSecond and sumSeries functions
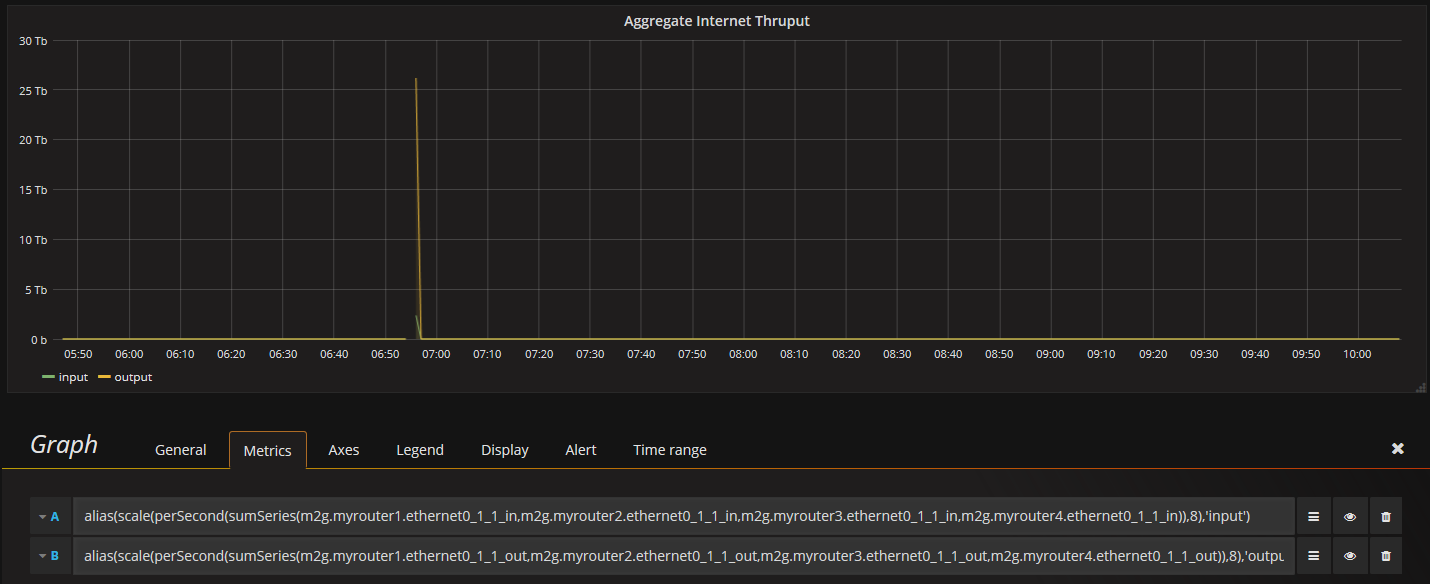
I have four internet circuits connected to four routers to provide highly available, high bandwidth connectivity to a site. It would be nice to view the combined input and output data rate over time of all four circuits on a single graph. My first attempt at this yielded a graph that occasionally had huge, false traffic spikes in it due to the rare, but inevitable missed SNMP poll. I started with these Graphite queries in Grafana:
#Input traffic rate
alias(scale(perSecond(sumSeries(m2g.myrouter1.ethernet0_1_1_in,m2g.myrouter2.ethernet0_1_1_in,m2g.myrouter3.ethernet0_1_1_in,m2g.myrouter4.ethernet0_1_1_in)),8),''input'')
# Output traffic rate
alias(scale(perSecond(sumSeries(m2g.myrouter1.ethernet0_1_1_out,m2g.myrouter2.ethernet0_1_1_out,m2g.myrouter3.ethernet0_1_1_out,m2g.myrouter4.ethernet0_1_1_out)),8),''output'')
The queries above produce the following graph. Notice the absurd spike
at about 06:56. This spike is way beyond the capacity of all the
circuits combined and makes the graph useless.
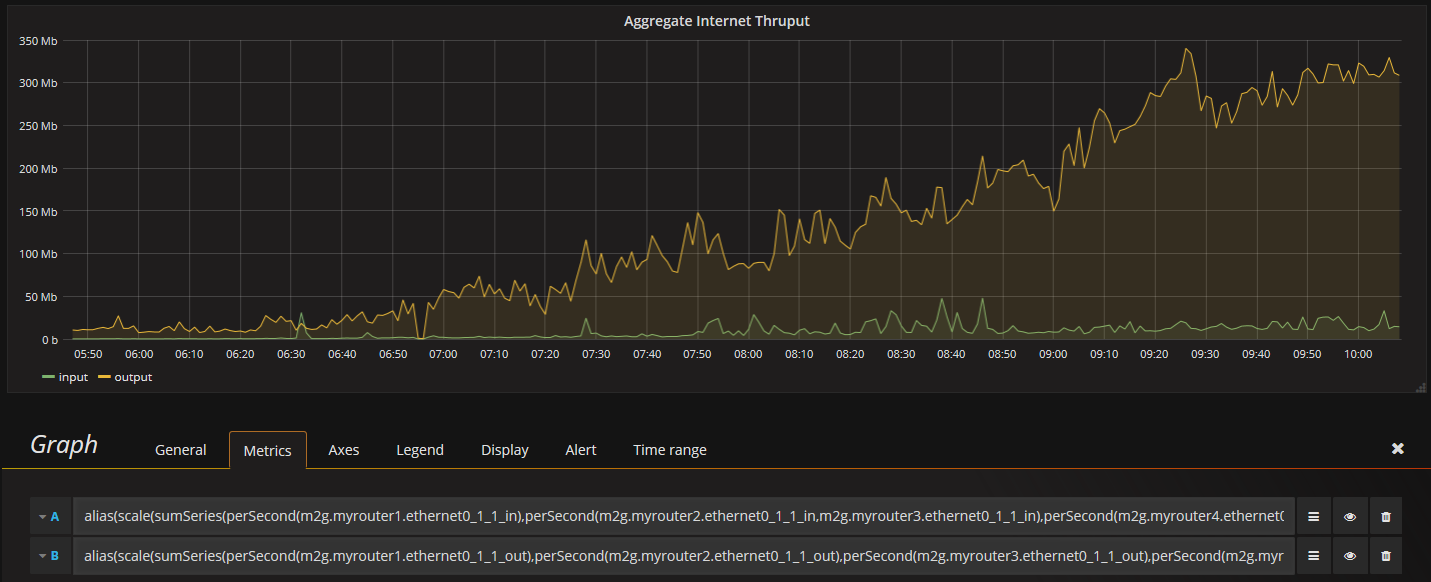
I was able to work around this problem by applying the perSecond function separately to each query, and then summing the resulting values. My fixed queries look like this…
# Input traffic rate
alias(scale(sumSeries(perSecond(m2g.myrouter1.ethernet0_1_1_in),perSecond(m2g.myrouter2.ethernet0_1_1_in,m2g.myrouter3.ethernet0_1_1_in),perSecond(m2g.myrouter4.ethernet0_1_1_in)),8),''input'')

# Output traffic rate
alias(scale(sumSeries(perSecond(m2g.myrouter1.ethernet0_1_1_out),perSecond(m2g.myrouter2.ethernet0_1_1_out),perSecond(m2g.myrouter3.ethernet0_1_1_out),perSecond(m2g.myrouter4.ethernet0_1_1_out)),8),''output'')
The new queries produce the graph below. Notice that the spike is gone, and in its place is a small gap.