Grafana/Graphite queries to calculate and plot TCP retransmit percentage
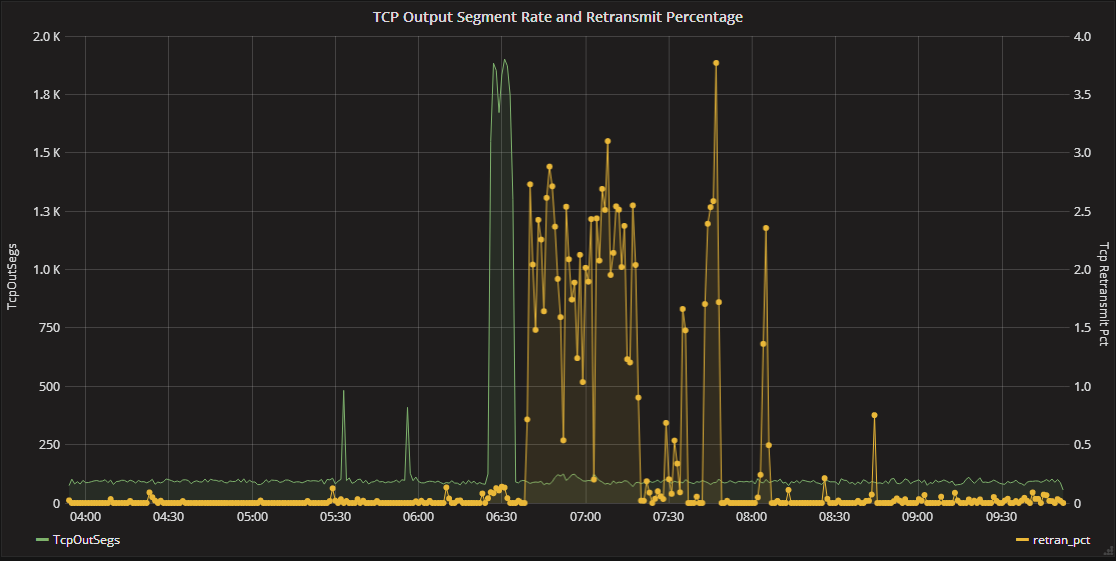
The graph above shows the TCP output segment rate (shaded line, scaled on the left) and the percent retransmissions (connected dots, scaled on the right). The retran_pct value is calculated by feeding the perSecond data from both TcpOutSegs and TcpRetransSegs into Graphite'’s asPercent function.
The Grafana target for the TcpOutSegs rate is pretty straight forward:
{
  "hide": false,
  "target": "alias(perSecond(wumpus.nstat.TcpOutSegs), ''TcpOutSegs'')"
}
The target for the retran_pct value is more complicated since it references both the TcpOutSegs target as #A and also has a targetFull attribute.
{
  "hide": false,
  "target": "alias(asPercent(perSecond(wumpus.nstat.TcpRetransSegs), #A), ''retran_pct'')",
  "targetFull": "alias(asPercent(perSecond(wumpus.nstat.TcpRetransSegs), alias(perSecond(wumpus.nstat.TcpOutSegs), ''TcpOutSegs'')), ''retran_pct'')"
}