Use performance metrics from Win32_PerfRawData instead of Win32_PerfFormattedData when collecting performance data on Windows systems
For the last 20 years I have been collecting and analyzing performance metrics from all manner of IT infrastructure equipment and applications. Servers, firewalls, routers, switches, load balancers, VPN concentrators, APMs, WAFs, telephony appliances, probes, per-app garbage collection stats, etc. You name it, I’ve spent time instrumenting through SNMP, WMI, and many other data acquisition methods. Almost all of this performance data has been stored as time series data points in round-robin databases like RRD (RRDtool) or WSP (Graphite) files.
One major problem that I have repeatedly run into on Windows that inevitably leads to significant and increasing (over time) statistical error is Microsoft’s apparent preference for referencing WMI performance data as formatted metrics instead of raw metrics. There are two performance data classes in Windows, Win32PerfRawData and Win32PerfFormattedData. They both represent the same set of metrics however if you query one metric from the Raw class & manually compute its delta over time and compare it to the same metric from the Formatted class you will very likely end up with vastly different results. The example below details the difference for a single metric, the TCPv4 Segment Transmit Rate.
First we’ll look at a ~30 minute plot of the TCPv4 segment transmit rate from our test system. This system is writing several megabytes of data to a CIFS share every minute in a bursty random-real-time manner similar to the traffic an end user would generate when working on and occasionally saving a large document to a network share. The actual metric being collected and graphed is “TCPv4 Segments_Sent_persec” from the Win32_PerfFormattedData class and is defined as the rate of TCPv4 packets transmitted per second. We’re collecting the metric once per minute on the minute so a snippit of our TSDB file content looks like this…
…and our graph looks like this…
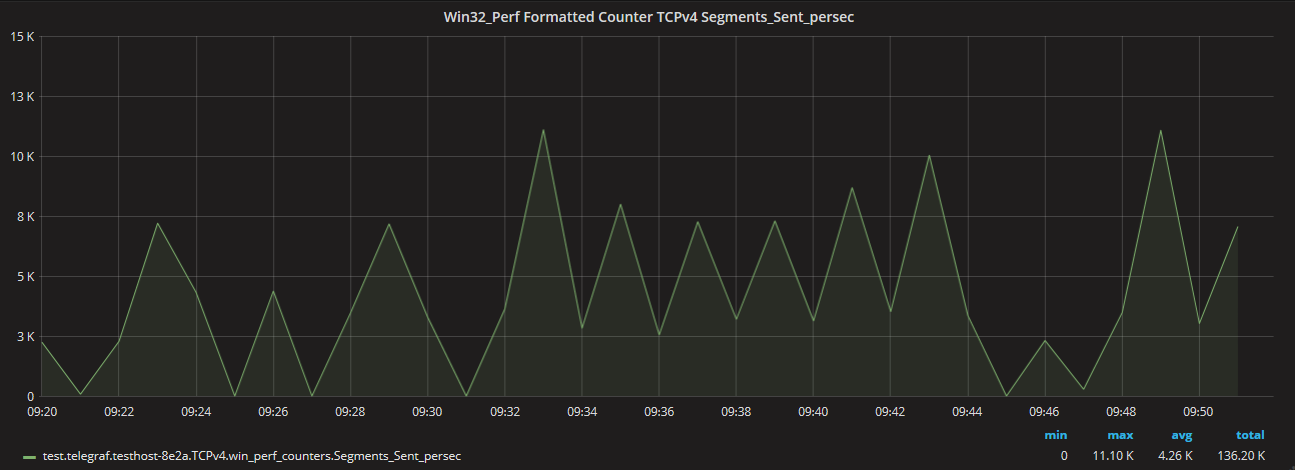 Notice the graph peaks & valleys and the min (0), max (11.10K), avg (4.26K), and
total (136.20K) values.
Notice the graph peaks & valleys and the min (0), max (11.10K), avg (4.26K), and
total (136.20K) values.
Now we’ll look at the TCPv4 Segments_Sent_persec from the Win32_PerfRawData class. It’s important to understand that in this case the “Segments_Sent_persec” metric name is very misleading as this is not a calculated persec rate but really is an always-increasing counter in the Win32_PerfRawData class that only decreases when it resets to zero after a reboot. Because we’re dealing with an always-increasing counter we have to apply Graphite’s perSecond function to calculate a rate over time. Here again we’re collecting the metric once per minute so we have ~30 data points.
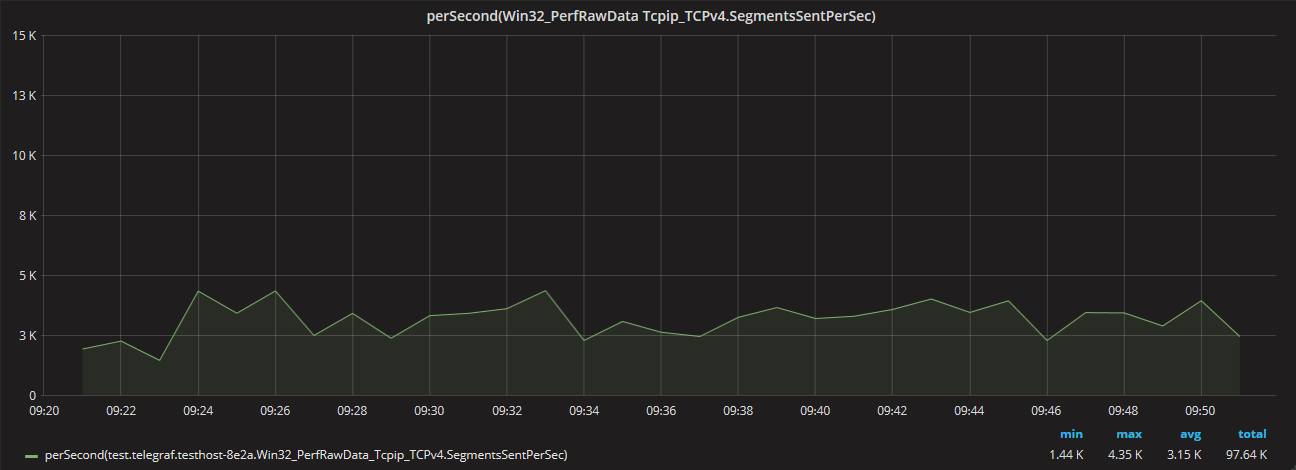
Notice that this produces a very different looking graph for the same host, same metric, and same time period with min 1.44K (versus 0), max 4.35K (-61% difference versus 11.10K), avg 3.15K (-26% difference versus 4.26K), and total 97.64K (-28% difference versus 136.20K).
To further illustrate the difference between the Win32_PerfFormattedData and Win32_PerfRawData metrics both TCPv4 segment transmit values appear in the graph below.
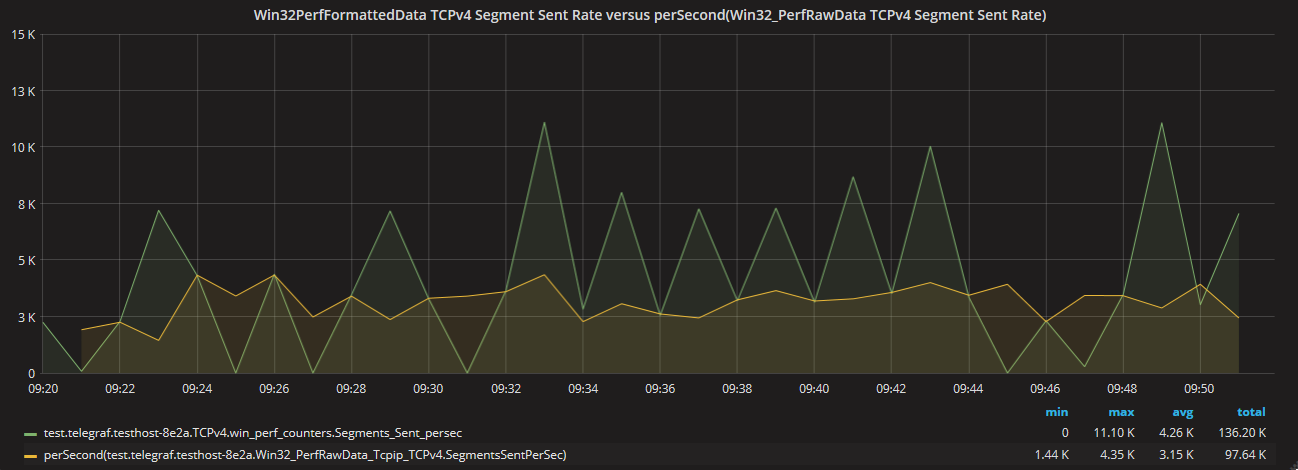
Now that it is abundantly clear that the performance data for the same metric, on the same host, over the same time period is significantly different, the next logical question is Which one is more accurate?
In most situations including this one, calculating a rate over time from an always-increasing (Win32_PerfRawData) counter is more accurate than sampling a pre-calculated (Win32_PerfFormattedData) value. This is true because you probably do not have knowledge of the time period in which the Win32_PerfFormattedData calculation takes place over and even if you do you must then sample the data at a very precise and predctiable interval inside that time period. Whereas if you rely on a an always-increasing counter then you can arbitrarily collect the value of the counter at any time and as long as you keep track of the amount of time that has passed between samples, an accurate average rate can be calculated over that time period.
If you do have knowledge of the time period in which the Win32_PerfFormattedData calculation takes place over and you can reliably obtain the calculated rate within that time period then the Win32_PerfFormattedData metric may be more accurate than collecting the counter data and computing an average rate. However, according to this MSDN article there are five different COOKER counter types defined so it may be necessary to take into account the min, max, range, variance, and average in order to more accurately use the Win32_PerfFormattedData metric.
\
What about data that does not lend itself to counters?
Not all performance data makes sense as an increasing counter. For example CPU utilization, memory utilization, queue depth, or the current number of open TCP sockets are expected to fluctuate up and down over time and it doesn’t make sense to put metrics such as these into an ever-increasing counter. In these cases you usually will not have a choice but to collect periodic samples over time from a precalculated (formatted) gauge-style variable. However it’s worth noting that in Windows the CPU utilization can be measured and calculated from the sum of two raw counters and if your sample interval is greater than the COOKER_AVG the result of calculating a rate form the counter will be more accurate. Under the Win32_PerfRawData class there are two objects called PerfOS_Processor PercentUserTime and PercentPrivilegedTime. These are ever-increasing counters and if you use the _Total instance of these objects you can derive the Total CPU Utilization (of all processors) with this formula:
\begin{equation} \left( \frac{Win32_PerfRawData_PercentUserTime_Total + Win32PerfRawData_PercentPrivilegedTime_Total}{10000000} \right) \cdot 100 \end{equation}
\
Is there an easy, fast, and efficient way to access Win32PerfRawData metrics from the command-line?
I have yet to find what I consider to be an acceptable method for acquiring metrics from Win32PerfRawData and passing them into a third party performance agent like Telegraf. For the TCPv4 Segments Sent example above I configured the Telegraf metrics agent to call an external perl script (getwmi.pl) that returned the value of Win32_PerfRawData_TCPv4_Segments_Sent_persec once per minute. In my opinion loading a perl interpreter that invokes Win32::OLE to emit a single metric is not easy, fast, or efficient. Finding the right metric path to successfully build the query is also time consuming and takes way too much trial and error guesswork. It would be nice to use something like typeperf but typeperf is quite old and appears to be limited to accessing Win32PerfFormatted data or at least couldn’t figure out a command line to successfully execute a Win32PerfRawData query. Another possibility is to use PowerShell’s Get-Counter cmdlet but in my case where I want to feed the data back through the Telegraf agent is spawning an entire powershell session just to obtain one metric any better than invoking a perl interpreter? They both feel like pretty high overhead and not-exactly-scalable methods for obtaining metrics.
Finally, I opened
this Telegraf feature request
asking for the ability to acquire and emit metrics from the Win32_PerfRawData class through the Telegraf’s
native Performance Data Helper consumer. Perhaps one of the Telegraf devs will be as interested in the
Win32_PerfRawData metrics as I am.
\
Additional information and reference links about this topic
WMIPerfInst Provider documentation from Microsoft
PowerShell Get-Counter Cmdlet Documentation
Performance counter access through PowerShell
Discussion about the same issue with Data Dog agent
Discussion about the same issue from Solarwinds
Win32_PerfRawData class documentation from Microsoft
Win32_PerfFormattedData class documentation from Microsoft
MSDN article about COOKER counter types that details average, min, max, range, and variance when Windows turns Win32_PerfRawData metrics into Win32_PerfFormatted metrics.
\
2019-01-02T13:59:47-06:00